A scalable platform for sensor networks with native MQTT/CoAP support, optimized time-series databases, and real-time analytics dashboards that transform urban data into actionable insights.

Our platform is built from the ground up to handle the complex requirements of smart city IoT deployments with a focus on reliability, scalability, and real-time processing.
Our platform includes built-in message brokers optimized for IoT communication patterns, ensuring reliable data transmission from diverse sensor networks without requiring additional middleware.
Purpose-built storage architecture designed specifically for the high-volume, time-stamped data streams generated by smart city sensor networks, with advanced compression and retrieval capabilities.
Interactive visualization interfaces that transform raw sensor data into actionable insights with sub-second refresh rates, customizable layouts, and advanced filtering capabilities.
Seamlessly connect with existing IoT ecosystems through standardized connectors and APIs, enabling unified data management across multiple platforms and vendor solutions.
Distribute intelligence to the network edge with our lightweight runtime environments that enable local data processing, filtering, and decision-making to reduce latency and bandwidth consumption.
Leverage advanced machine learning models to detect anomalies and predict equipment failures before they occur, enabling proactive maintenance scheduling and extending the lifespan of critical infrastructure.
Our scalable architecture is designed to handle millions of data points per second while maintaining sub-millisecond query performance and high availability.
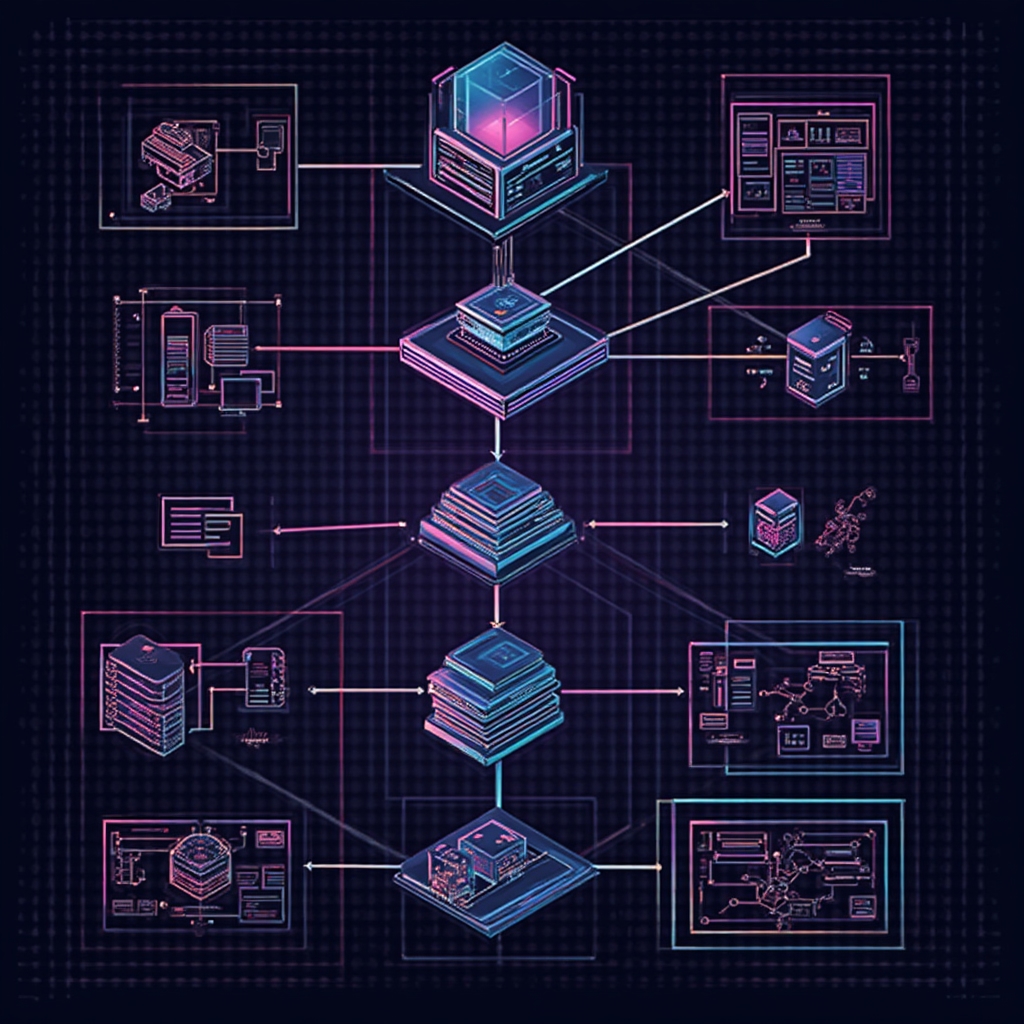
The journey begins at our highly available ingestion layer, which serves as the entry point for all sensor data. This layer consists of horizontally scalable MQTT and CoAP brokers that handle device authentication, message validation, and initial processing.
Key features include:
Once data passes through the ingestion layer, it's routed to our specialized time-series storage engine. This component employs sophisticated compression algorithms and indexing strategies to optimize both write throughput and query performance.
The storage layer implements:
The final stage transforms raw data into actionable insights through our real-time analytics engine. This component performs complex calculations, trend analysis, and anomaly detection before delivering results to dashboards and API consumers.
The analytics pipeline provides:
Our architecture is designed to scale horizontally at every layer, allowing you to start small and grow as your sensor network expands. Each component can be independently scaled based on your specific workload characteristics:
Discover how our IoT data platform is transforming urban environments through intelligent sensor networks and real-time analytics.

Our platform aggregates data from various traffic sensors including inductive loops, cameras, and pedestrian counters to create a comprehensive real-time view of urban mobility patterns.
The system performs continuous analysis to identify congestion points and automatically adjusts traffic signal timing to optimize flow, reducing average commute times by up to 25% in pilot deployments.

Our platform connects distributed environmental sensor networks to track air quality, noise levels, and microclimate conditions throughout the urban landscape with high spatial resolution.
The system's time-series analytics engine identifies pollution patterns, correlates them with traffic and industrial activities, and helps city planners implement targeted interventions to improve environmental quality.

Our platform transforms traditional street lighting into an intelligent, responsive network that adapts illumination levels based on ambient conditions, pedestrian presence, and municipal schedules.
The edge computing capabilities enable local decision-making for immediate response to environmental changes, while the predictive maintenance algorithms identify potential failures before they occur, reducing maintenance costs by up to 30%.
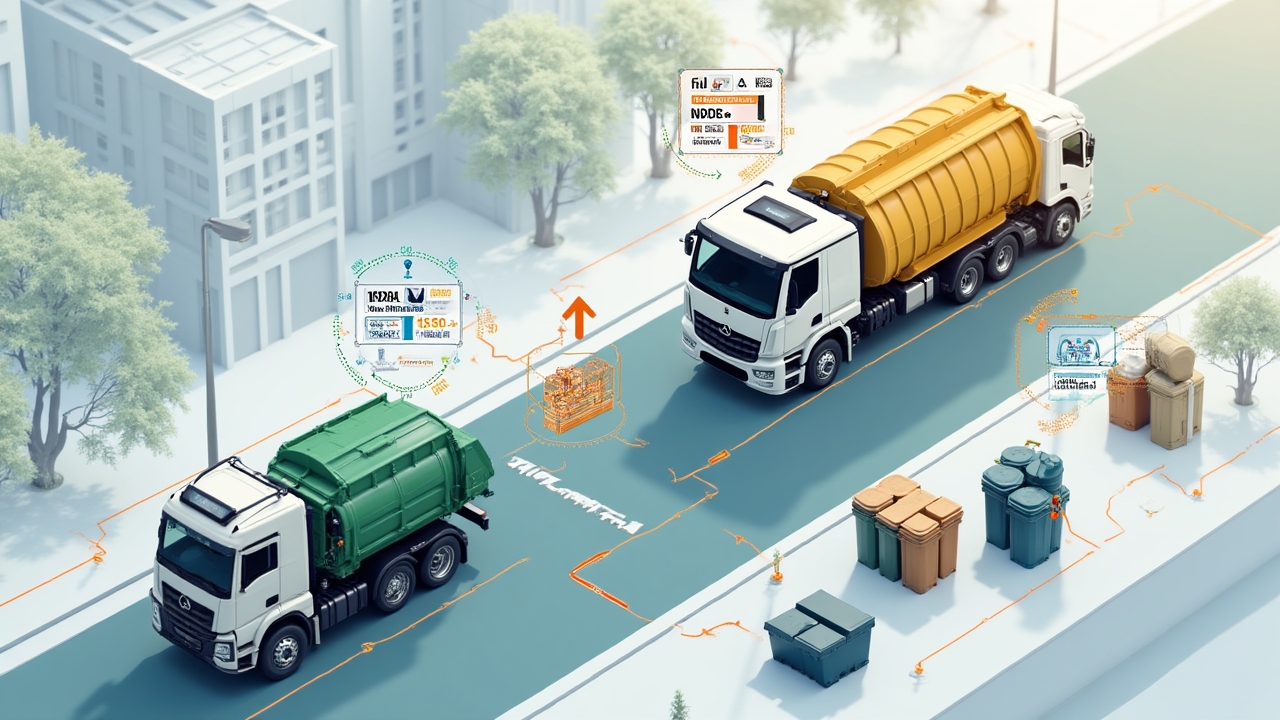
Our platform connects to ultrasonic fill-level sensors installed in waste containers to monitor capacity in real-time, enabling demand-based collection scheduling rather than fixed routes.
The system's route optimization algorithms consider current fill levels, historical patterns, and traffic conditions to generate efficient collection paths, reducing fuel consumption and operational costs while preventing overflow incidents.
Experience how our intuitive dashboards transform complex sensor data into actionable insights through real-time visualization and analytics.
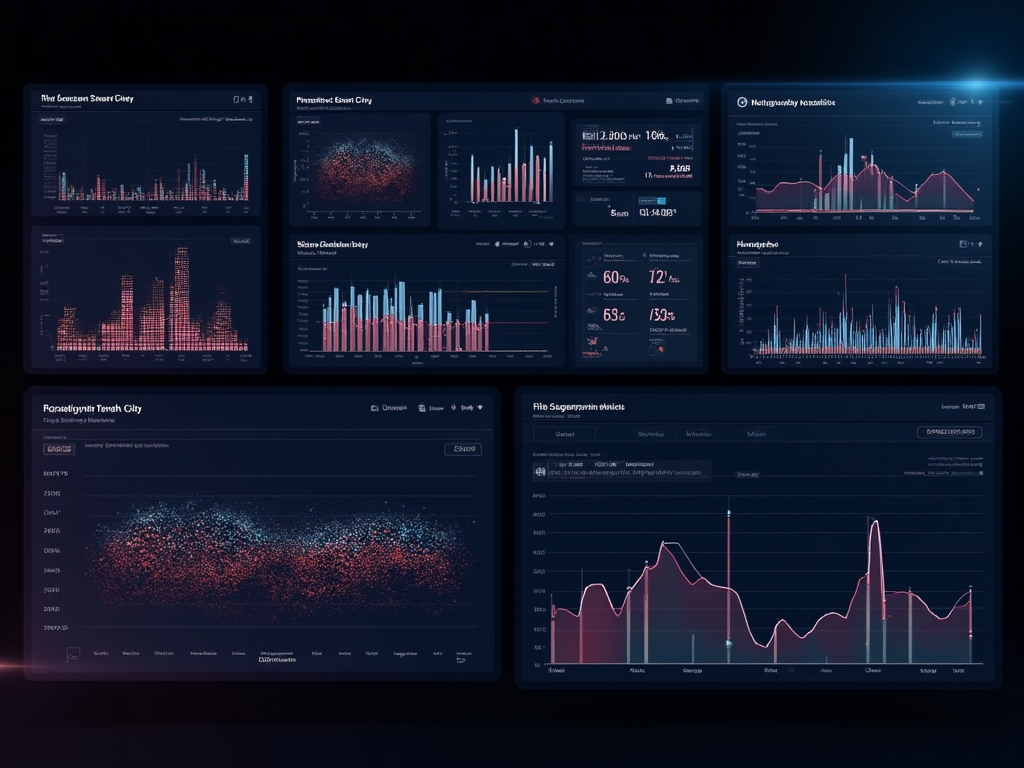
Track critical performance indicators with sub-second updates and configurable thresholds. Dashboards support both aggregate metrics and detailed breakdowns by zone, sensor type, or custom dimensions.
Analyze temporal patterns with interactive charts featuring zoom, pan, and comparison capabilities. Supports multiple visualization types including line, area, bar, and candlestick charts with customizable time windows.
Visualize sensor data in spatial context with interactive maps featuring heatmaps, cluster analysis, and zone-based aggregation. Supports multiple base layers and custom overlay configurations.
Our platform is engineered to handle massive IoT deployments with exceptional throughput, minimal latency, and seamless scaling capabilities.
Our ingestion layer can process over one million messages per second per cluster, with linear scaling as you add nodes. The distributed architecture ensures even load distribution and eliminates bottlenecks.
From sensor transmission to dashboard visualization, our platform maintains sub-10ms latency for real-time operations. Edge computing options can further reduce latency for time-critical applications.
Our time-series storage engine supports petabyte-scale deployments with intelligent data lifecycle management. Automated tiering moves data between hot, warm, and cold storage based on access patterns.
Every component of our architecture is designed for horizontal scaling, allowing you to add capacity precisely where needed. The system automatically rebalances workloads when new nodes are added, ensuring optimal resource utilization.
Our platform implements configurable retention policies with automatic downsampling to balance storage costs with analytical needs. Recent data is kept at full resolution, while historical data is progressively compressed through intelligent aggregation that preserves analytical value while reducing storage requirements.
Our platform implements comprehensive security measures and privacy-by-design principles to protect sensitive data and meet regulatory requirements.

We implement end-to-end encryption for all data in transit and at rest, with granular access controls and comprehensive audit logging. Our architecture supports data sovereignty requirements with configurable geographic storage constraints.
Our platform is built with privacy as a foundational principle, incorporating data minimization, purpose limitation, and user consent management. We provide tools to help you implement privacy-preserving data collection and processing practices.
Our platform is designed to help you meet regulatory requirements including:
Contact us to schedule a personalized demo or discuss how our platform can address your specific smart city challenges.